Supplemental information for “India’s Air Pollution Crisis: By the Numbers”
V. Faye McNeill and Julia K. Nunes
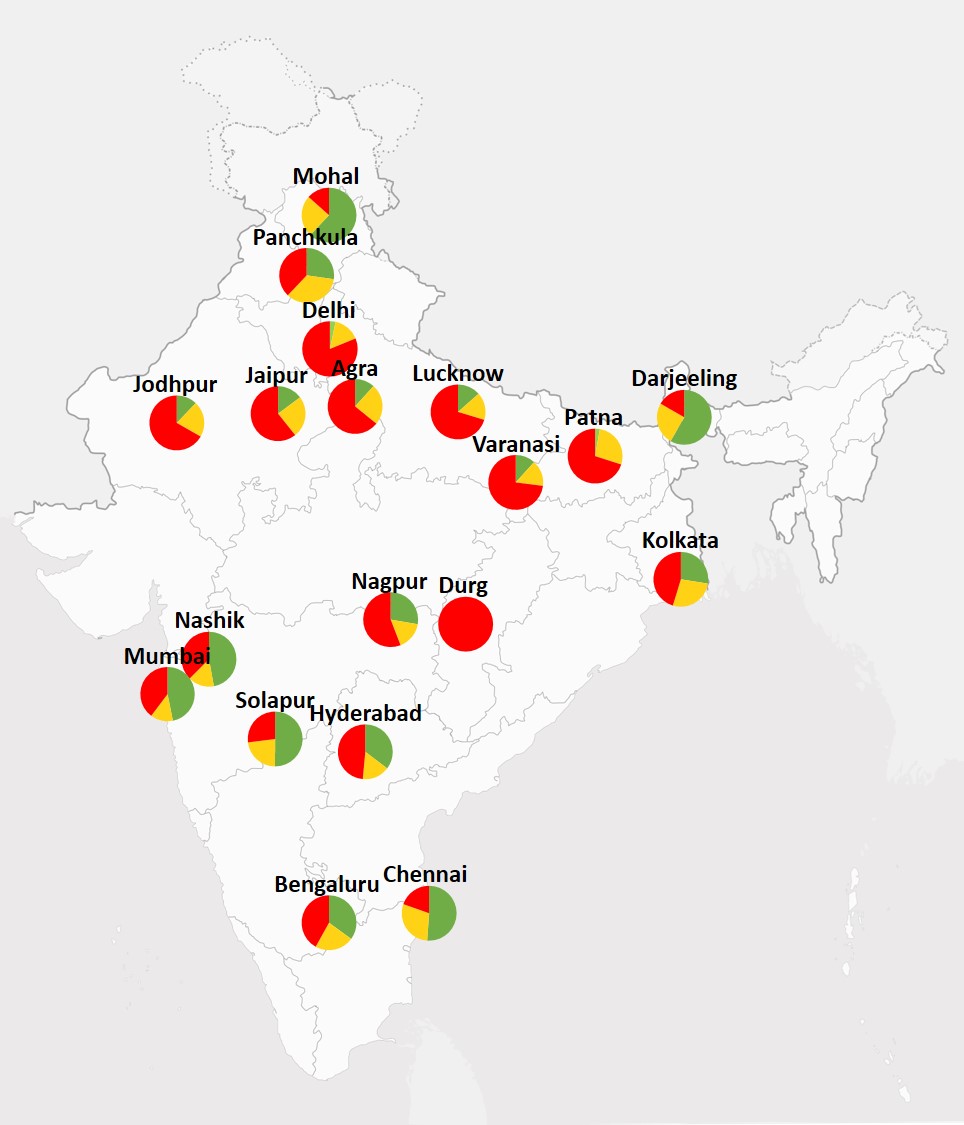
The pie charts represent counts of days falling into three categories based on the 24 hour average, following the US EPA AQI breakpoints: Good/Moderate (green, PM2.5 < 35.4 μg m-3), Unhealthy for Sensitive Groups, (yellow, 35.5 to 55.4 μg m-3) and Unhealthy, Very Unhealthy, or Hazardous (red, >55.5 μg m-3). Except as noted below, each pie chart was made by taking 24 hour averages of all PM2.5 continuous monitoring data available for that city on openaq.org for Sept 2016-Oct 2017 (exactly one year of data was used – due to data availablility the exact date windows sometimes differed). Data are provided by CPCB, U.S. diplomatic posts, and local and state pollution control boards, and accessed through openaq.org. When multiple datasets in one city were available, the data were averaged. Data were filtered for flagged data or instrument malfunction (e.g. 999, -999, negative data). When data within the observation period were missing, they were replaced with a monthly average. When two locations were geographically close enough to have too much overlap for both graphs to be read clearly, the location with higher population was used. When less than a year of data was available, the data were not analyzed except as noted below.
Exceptions
- Monthly average data used for Bengaluru from KSPCB for Oct 2016-February 2017 (when PM2.5 continuous monitoring began). February 2017-Oct 2017 at three locations from CPCB, BWSSB.
- Nagpur continuous monitoring data available starting in mid-October 2016, so missing days are assigned the average of the available October values.
- Data for Mohal, Himachal Pradesh were from the PhD thesis of Dr. Priyanka Sharma, Shoolini University (2013) for January 2011-December 2012.
- Data for Durg City, Chhattisgarh were from the year-long (July 2009-June 2010) continuous monitoring study published by D. K. Deshmukh et al. Aerosol Air Qual. Res. 11: 696-708 (2011).
- Data for Darjeeling, West Bengal from Chatterjee et al. PLoS ONE 5(6): e11122. doi:10.1371/journal.pone.0011122
Additional notes (up to date as of October 2017)
- ANDHRA PRADESH: Continuous PM2.5 monitoring data available for Hyderabad from TSPCB in multiple locations and the US Diplomatic post. Continuous PM2.5 monitoring data for Andhra Pradesh locations Tirupati, Visakhapatnam, Rajamahendravaram, and Vijayawara only available for less than one year. Therefore, they were not included in this analysis.
- BIHAR: Data available for Patna, Gaya, Muzaffarpur. Only Patna shown due the proximity of the three locations.
- GOA: PM2.5 data available at 3-5 day intervals for several cities via Goa State Pollution Control Board. Most recent data April 2017. Data not shown because the reported PM2.5 values seem low compared to residential monitors, satellite observations and chemical transport modeling.
- GUJARAT: Continuous PM2.5 monitoring data available for Ahmedabad for February-March 2017, and resuming again in late September 2017. Yearly average data for 2014-2015 for several locations is available via the GSPCB website.
- HARYANA: Over a year of continuous monitoring data for Gurgaon, Panchkula, Rohtak. Only Panchkula shown on the figure since Rohtak, Gurgaon overlap with the Delhi chart. Faridabad continuous PM2.5 data available only starting February 2017.
- JAMMU & KASHMIR: Monthly PM2.5 reports for Jammu City are available starting in April 2017 from JKSPCB. Since less than a year of data was available, these data were not used in the figure.
- JHARKAND: continuous monitoring at Jorapokhar starting in August 2017 does not include PM2.5
- KARNATAKA: Bengaluru – continuous PM2.5 monitoring at multiple sites run by CPCB, BWSSB, and KSPCB starting February 2017. Prior to that, monthly average PM2.5 data available from KSPCB. See note under ‘Exceptions‘ above.
- KERALA: Thiruvananthapuram continuous PM2.5 monitoring starting in June 2017. Since less than a year of data was available, these data were not used in the figure.
- MAHARASHTRA: Continuous PM2.5 monitoring at multiple locations in Mumbai, Pune, Nagpur, Nashik, Solapur, Aurangabad, Chandrapur, Thane from MPCB.
- NCR: Continous PM2.5 monitoring data available for multiple locations for Delhi from CPCB, U.S. Diplomatic Post, IMD. Data also available for NOIDA.
- PUNJAB: PM2.5 data only available for Amritsar and Ludhiana starting February 2017 and Mandi Gobingarh starting in March 2017. Historical air quality data only available as RSPM.
- RAJASTHAN: Continuous monitoring data are available for Jodhpur and Jaipur.
- UTTAR PRADESH: Continous PM2.5 monitoring data available from multiple sources and locations for Lucknow from CPCB, UPPCB. Single location data available for Varanasi, Kanpur, Agra. Less than one year of monitoring data available for Moradabad, Ghaziabad.
- WEST BENGAL: Kolkata – PM2.5 continuous monitoring data are available from the US Diplomatic Post. WBPCB monitoring data only available for PM10 in Kolkata and other cities. Data for Darjeeling from Bose Institute monitoring station as noted above in ‘Exceptions.‘
- To our knowledge no PM2.5 continuous monitoring data available for: Arunachal Pradesh, Assam, Jharkand, Madhya Pradesh, Manipur, Meghalaya, Mizoram, Nagaland, Odisha, Sikkim, Tripura,Uttarakhand. No current data found for Himachal Pradesh or Chhattisgarh. Data used were from past PM2.5 monitoring studies published in the scientific literature as noted above under ‘Exceptions‘.