A ccording to the New York City Department of Health and Mental Hygiene, air quality in NYC is getting better. Here at AIRE, we hypothesized the opposite last summer. Based on a very unscientific survey of our own asthma responses and perceptions of visibility in the city, we suspected that summertime air quality had been on the decline in recent years (2014-2015). To test this hypothesis, summer undergraduate researcher Silvia Vina Lopez gathered Air Quality Index (AQI) data for NYC from 2000-2015, and data on criteria pollutant (SO2, CO, NO2, O3, PM) concentrations from 9 NYSDEC monitoring sites around the five boroughs. Here are some highlights of her findings:
- Overall, air quality has been improving since 2000. Importantly, there has clearly been a steady decrease in the number of “bad air days”. Since 2000, the number of days categorized as “Unhealthy for sensitive groups,” “Unhealthy,” or “Very unhealthy” has been on the decline.
- Since 2008, the number of “Good” air quality days has had an overall upward trend, but there indeed has been a sharp decrease in “Good” days since 2013. Since “Moderate” air quality is also pretty good in the big scheme of things, this trend may be subtle to perceive as you’re walking the streets of NYC unless you have asthma (like us) or think about PM 2.5 a lot (also like us).
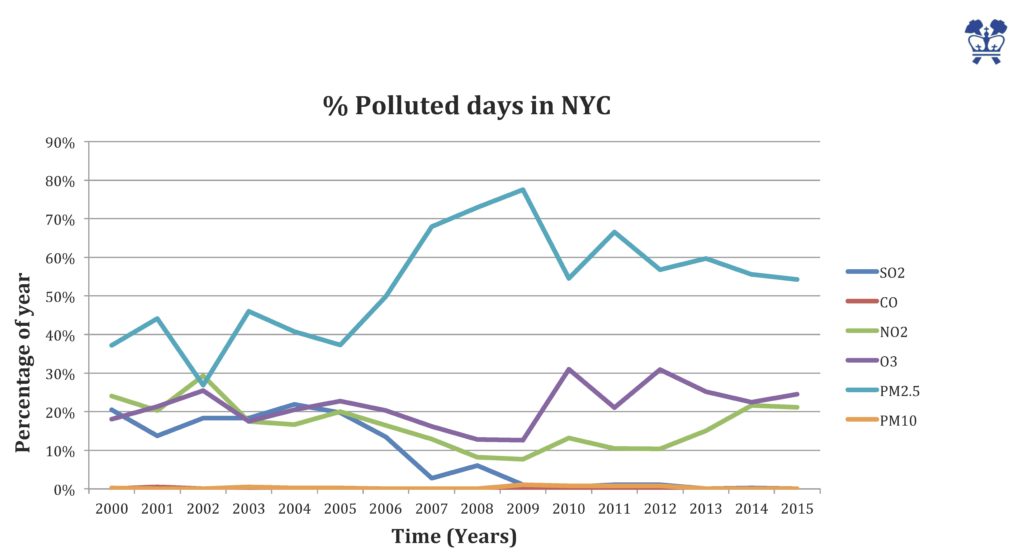 To dig deeper into these trends, Silvia investigated the frequency with which each criteria pollutant exceeded the 24 h NAAQS standards. She found that SO2 violations decreased between 2004-2009 and have stayed low. The City attributes this trend to changes in heating oil regulations. On the other hand, the frequency of PM2.5 violations increased over the same time period and has remained elevated since 2009. This value decreased somewhat between 2007-2015, consistent with the data presented in the City’s survey, which covered 2008-2014. However, the average number of PM2.5 violations 2009-2015 was still significantly higher than 2000-2005.
The verdict: air quality in NYC is not bad and getting better in general. However, work needs to be done to reduce PM2.5 violations, and hold on to the gains made between 2008-2014. One possible source of elevated PM2.5 not mentioned in the City’s report is secondary organic aerosol formation: the formation of PM2.5 in situ, due to gas-phase reactions of oxidants and volatile organic compounds (which can be natural or man-made).
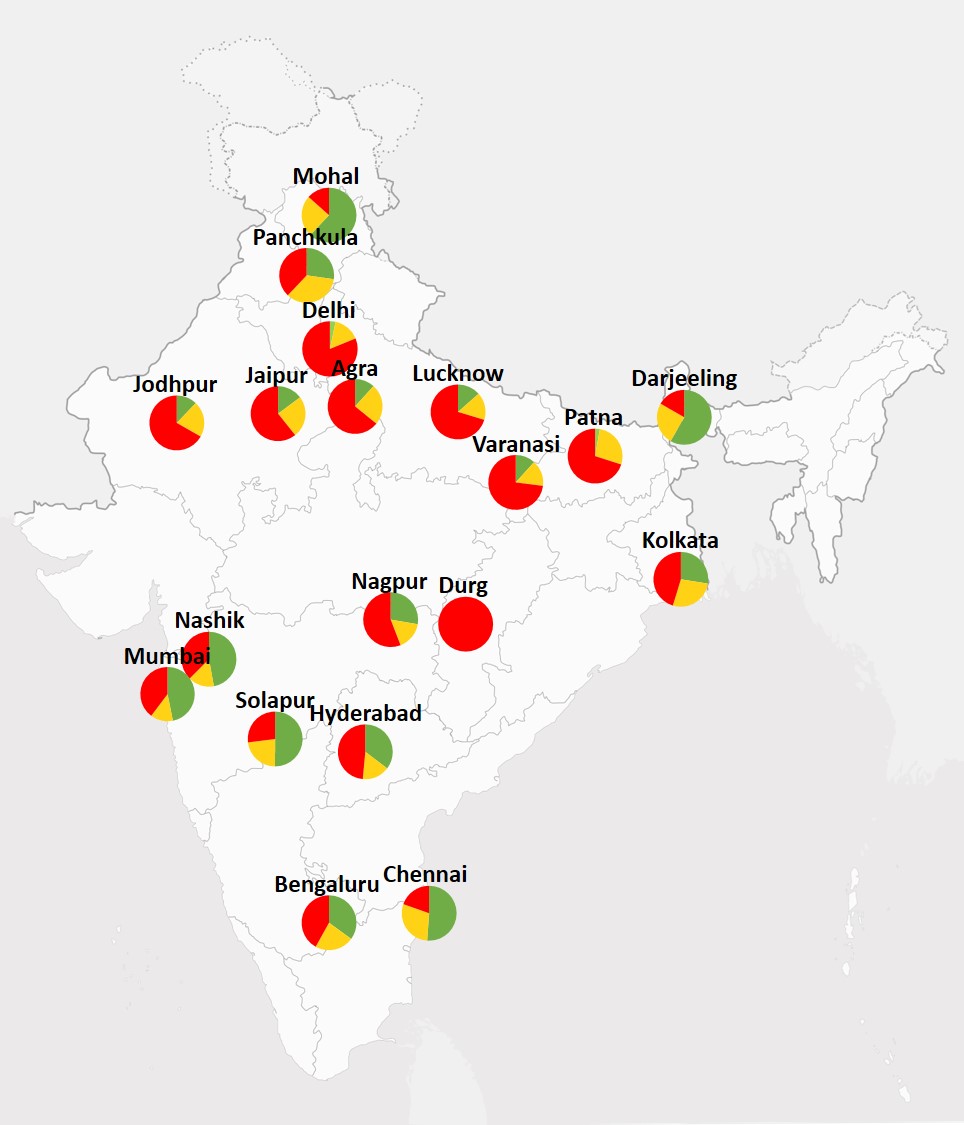 The pie charts show the number of days in the past year that the average PM2.5 level fell into the following three categories: Green days (PM2.5 < 35.4 μg m-3) are healthy or moderate, yellow days (35.5 μg m-3 to 55.4 μg m-3) are unhealthy for sensitive groups such as children, the elderly or those with lung disease, and red days (PM2.5 > 55.5 μg m-3) are unhealthy for all. For more information on the data sources: https://aire.mcneill-lab.org/india-aq-2016-2017/